Boats Group OEM Reporting Suite: Unlocking Consumer Insights to Drive OEM Market Strategy
Product
Data visualization dashboard
Role
Lead designer
Task
New product launch
Redesign
+ product expansion
For almost 30 years, Boats Group has been the leading company for marine marketplaces, reaching 22 million monthly users across their 11 brands. In 2019 I worked with the VP of Product to launch a new data offering for OEMs (original equipment manufacturers), to unlock insights into consumer behavior across our platforms. Until this project, our OEM-related revenue was limited to ad placements, and our consumer data was only reported on at the individual platform level. Recognizing the value in our untapped consumer data, we seized the opportunity to design a reporting tool that would empower OEMs to better understand their markets, optimize distribution, and strategically allocate marketing budgets.
Product
Data visualization dashboard
Role
Lead designer
Task
New product launch
For almost 30 years, Boats Group has been the leading company for marine marketplaces, reaching 22 million monthly users across their 11 brands. In 2019 I worked with the VP of Product to launch a new data offering for OEMs (original equipment manufacturers), to unlock insights into consumer behavior across our platforms. Until this project, our OEM-related revenue was limited to ad placements, and our consumer data was only reported on at the individual platform level. Recognizing the value in our untapped consumer data, we seized the opportunity to design a reporting tool that would empower OEMs to better understand their markets, optimize distribution, and strategically allocate marketing budgets.


My role
My role
My role
As the lead designer on this project, I worked closely with the Head of BI, VP of Sales, Account Management, and Development, taking the OEM Reporting Suite from concept to launch in a 2 month span.
My role
As the lead designer on this project, I worked closely with the Head of BI, VP of Sales, Account Management, and Development, taking the OEM Reporting Suite from concept to launch in a 2 month span.
Challenges and pain points
Challenges and pain points
Challenges and pain points
Very expensive data project: we have never compiled consumer data to this degree of detail across our platforms. If mis-managed, we would burn through the budget too quickly.
Data volume and complexity: we had a vast range of data points, the sheer volume risked overwhelming users. We had to find what was most valuable for our customers.
Reliability and consistency: To maintain trust with OEMs, we had to validate data sources and ensure accurate, dependable insights.


Goals
Goals
Goals
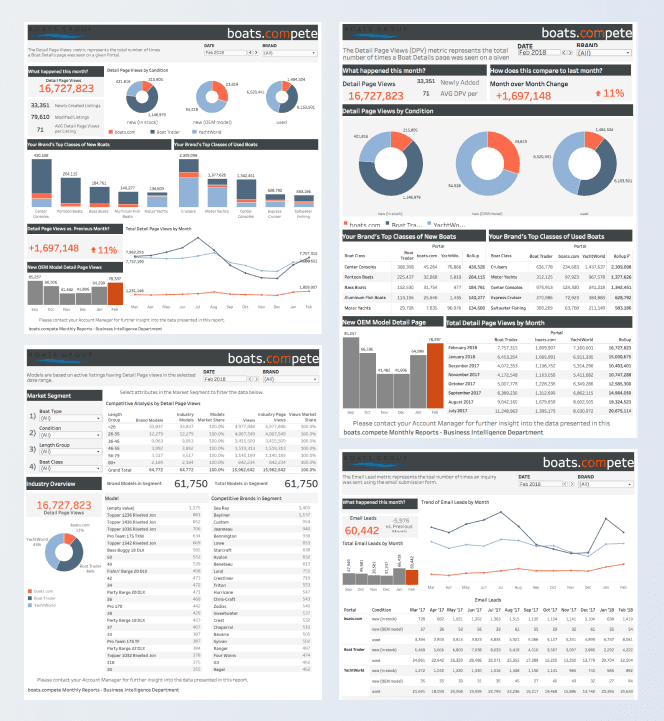
Validate the concept: before building a custom reporting suite, we needed a proof of concept. We used Tableau to confirm the OEM market demand and fine-tune the specific data visualizations needed.
Scalability: This tool was the foundation of a larger data initiative. Our design needed to be modular, allowing for quick expansion as new data categories and requirements arose.
Cater to multiple user levels: Ensure the design served both high-level users (like CEOs looking for market trends) and technical users (such as analysts seeking detailed insights). Really understand and highlight the most relevant data points and prioritize usability, so that our product was both powerful and accessible.
Results & impact
Results & impact
Results & impact
We identified the stars of the show: as we worked through the visualizations and user testing, it became evident that the most desired data came from the top three portals; Yachtworld, Boat Trader and Boats.com. We focused on providing the best accumulative data sets from these sites only, making the data quality checking process much easier and providing more confident results.
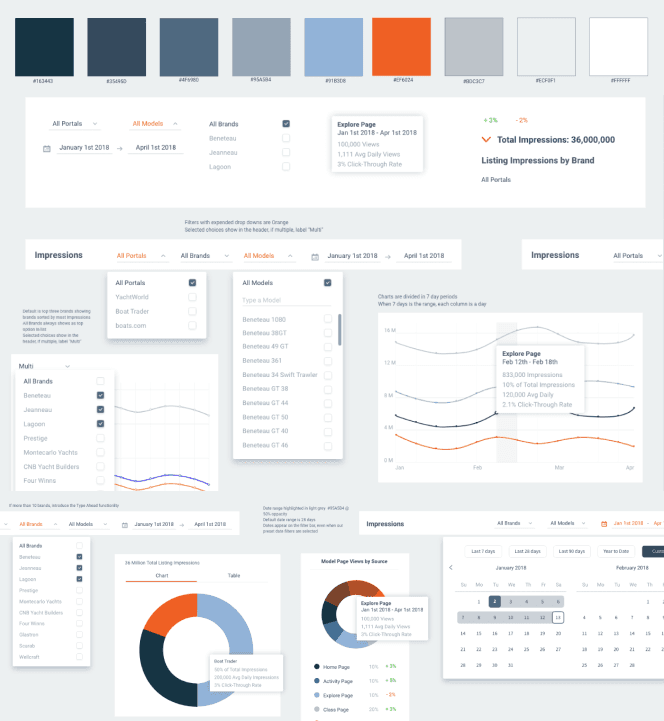
Scalable component library: based on our Tableau proof of concept, we knew what data visualization components we needed to produce. I developed a wide component library that would enable us to add new data categories easily. I worked closely with the development team to utilize existing libraries as our backbone.
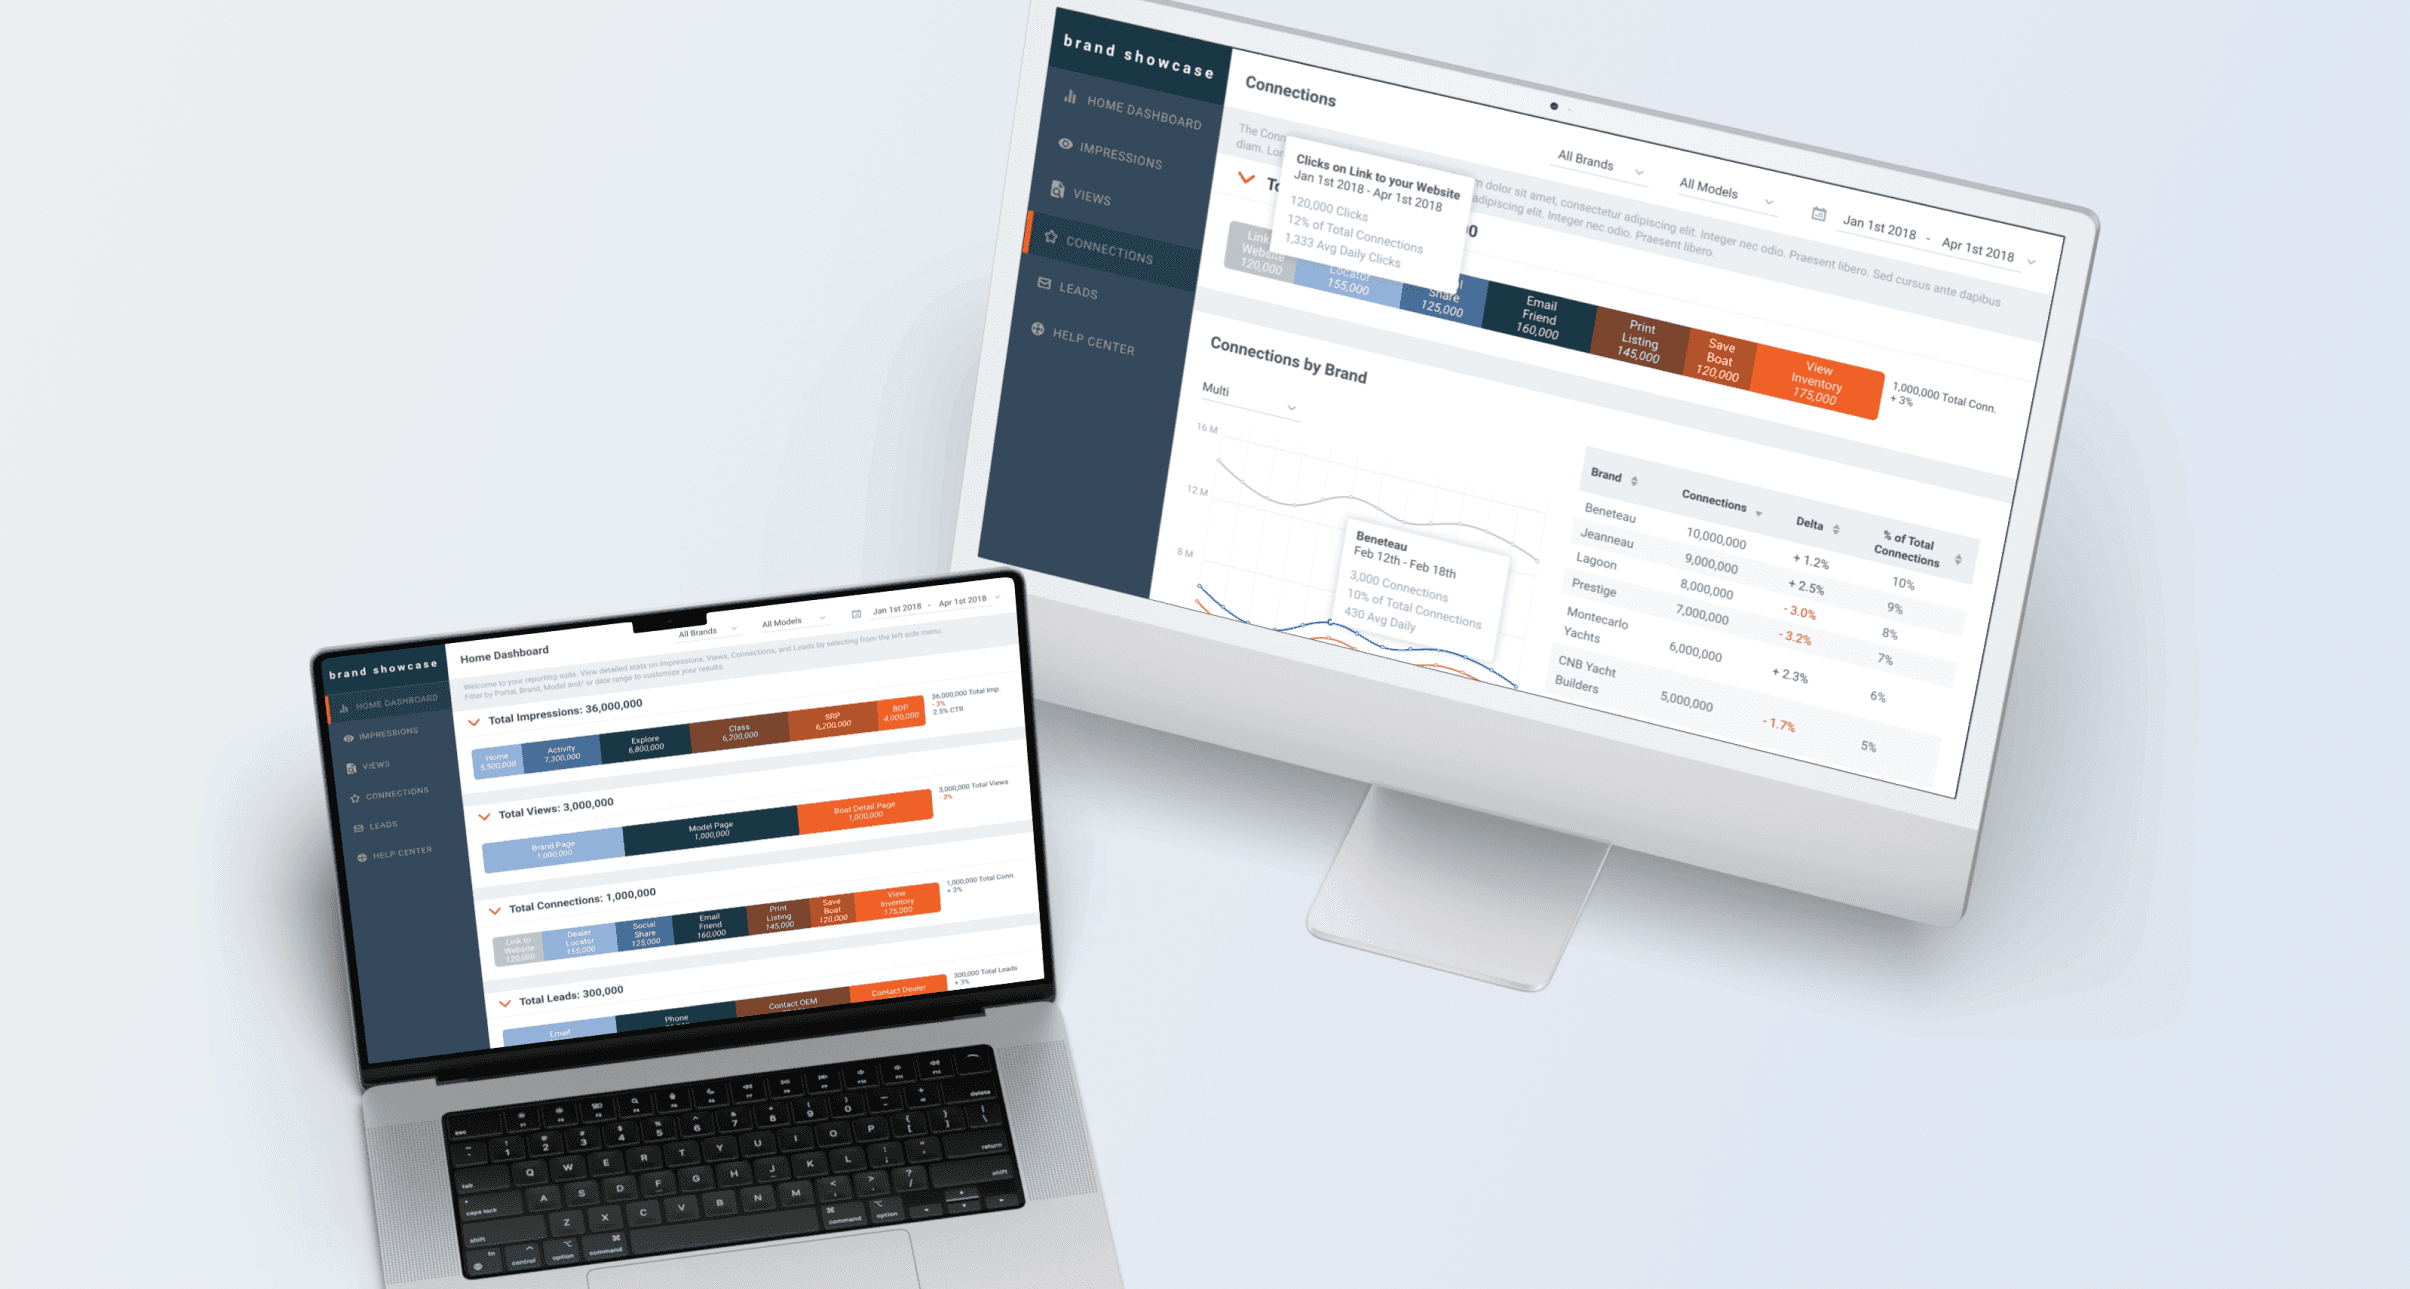
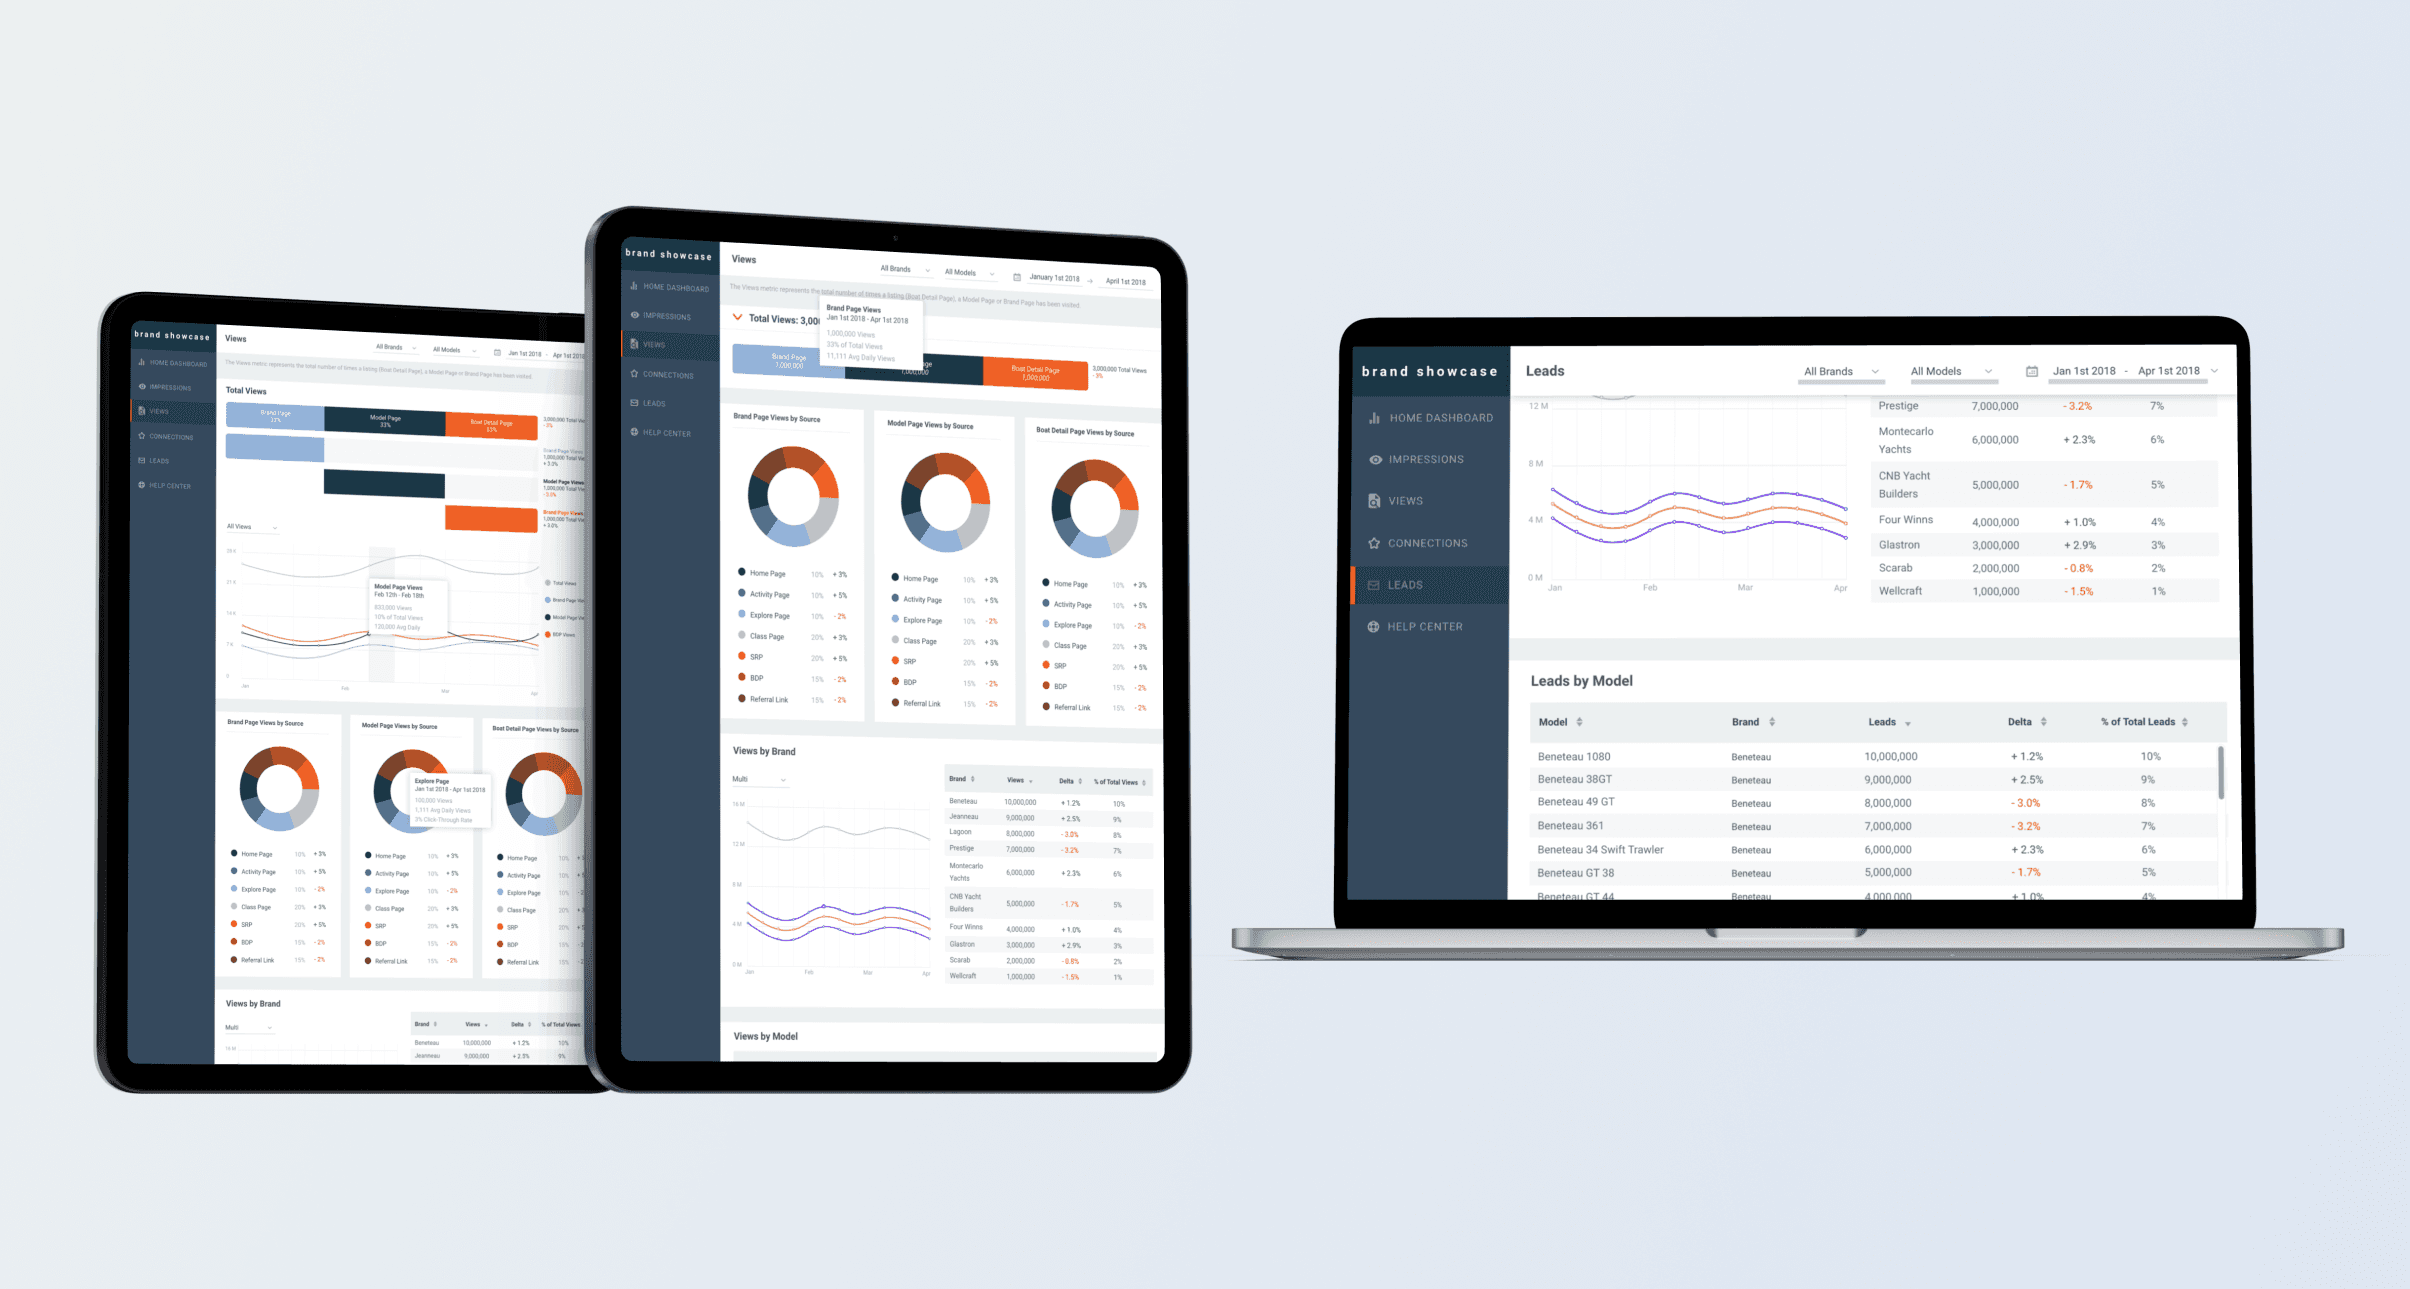
Comprehensive yet accessible dashboards: The suite provided dashboards with rich visualizations for data points such as site impressions, user views, connections, and leads, allowing OEMs to filter by portal, dates, brands, models, and more. We balanced high-level trend analysis with drill-down capabilities, ensuring that CEOs could spot overarching patterns while analysts accessed detailed data.


View Previous
The OEM Reporting Suite successfully transformed our data from a dormant asset into a valuable, revenue-generating product. By using our resources efficiently, finding the most valuable data to focus on, and catering design to our varied users, we supported OEMs in making data-driven decisions on market strategies, distribution, and ad spend. This product set the groundwork for a larger data initiative, tapping further into the OEM industry.
The OEM Reporting Suite successfully transformed our data from a dormant asset into a valuable, revenue-generating product. By using our resources efficiently, finding the most valuable data to focus on, and catering design to our varied users, we supported OEMs in making data-driven decisions on market strategies, distribution, and ad spend. This product set the groundwork for a larger data initiative, tapping further into the OEM industry.
Let's Connect
Maybe one day we’ll meet sea-side, surrounded by a language we don’t speak - at golden hour. Until then, perhaps it starts in my DMs?
alida.gagliuffi@gmail.com, or shoot me a note right here:
Let's Connect
Maybe one day we’ll meet sea-side, surrounded by a language we don’t speak - at golden hour. Until then, perhaps it starts in my DMs?
alida.gagliuffi@gmail.com, or shoot me a note right here:
Let's Connect
Maybe one day we’ll meet sea-side, surrounded by a language we don’t speak - at golden hour. Until then, perhaps it starts in my DMs?
alida.gagliuffi@gmail.com, or shoot me a note right here: